Observability
Dashboard health hub and webhook automation: callbacks and delivery logs with screenshots.
Sidebar: Observability
Observability covers fleet health monitoring and outbound webhook automation.
Health hub
Path: /dashboard/observability
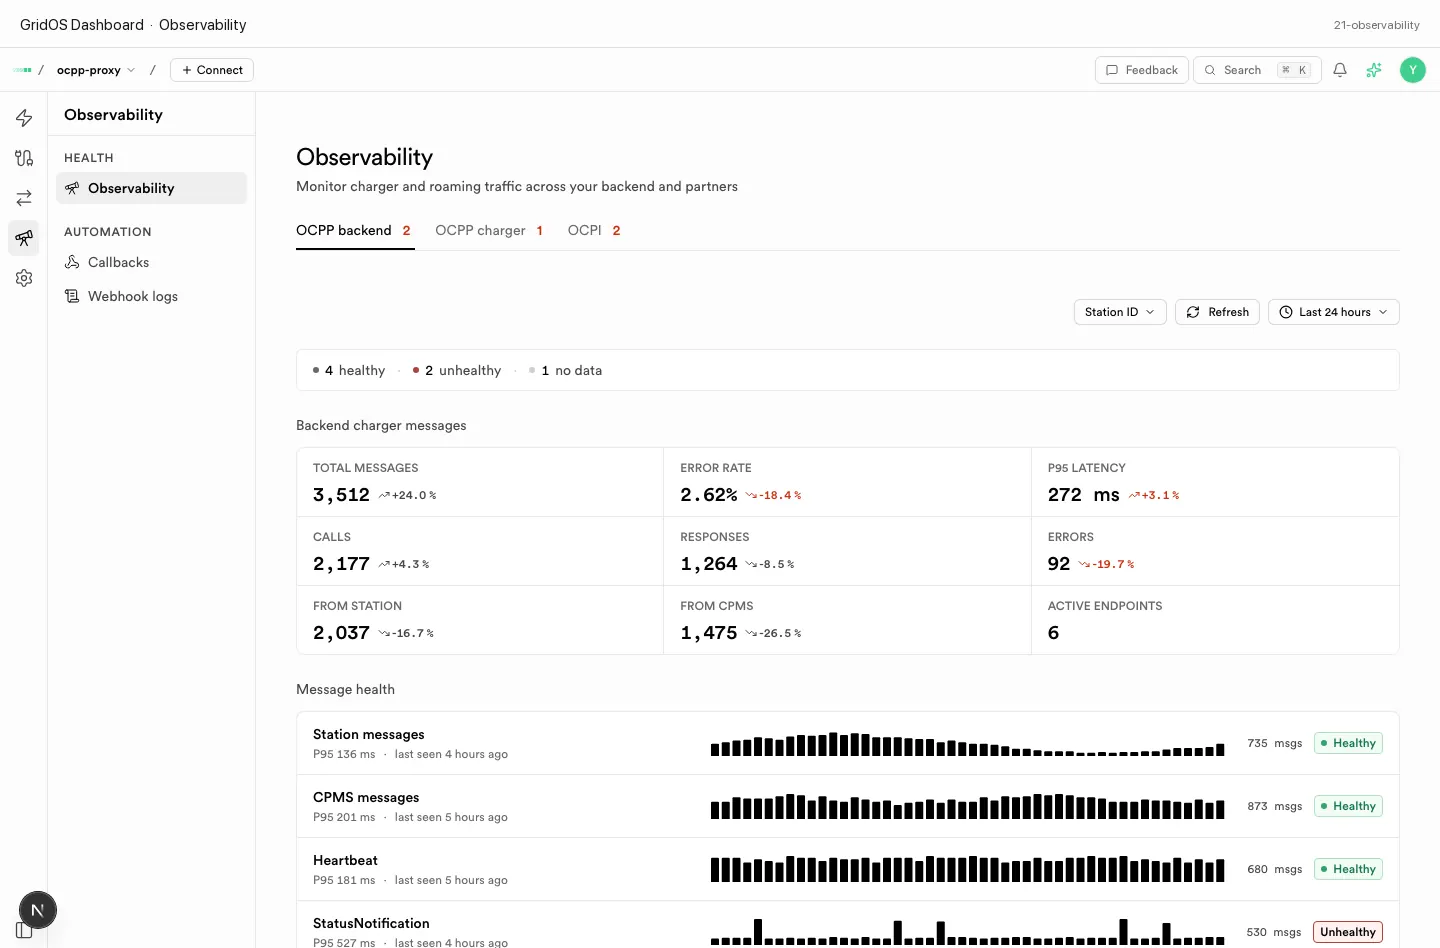
Observability — fleet health and monitoring hub (some probes are plan-gated).
Use this page for operational health signals after chargers are online. Older /dashboard/monitoring/* routes redirect here.
Webhook callbacks
Path: /dashboard/webhooks
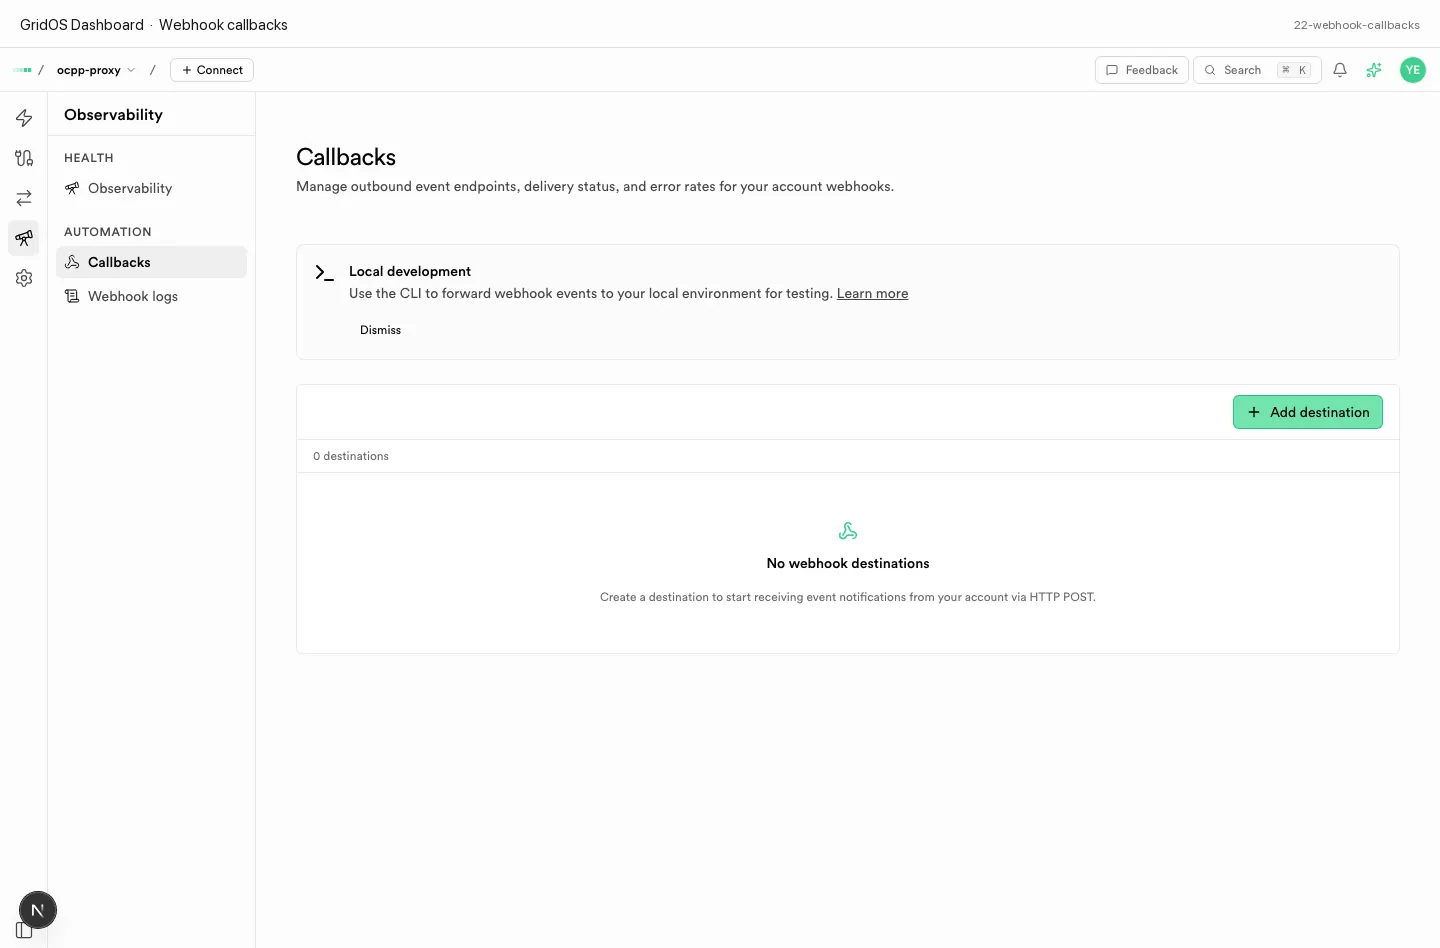
Webhooks — register HTTPS callbacks and signing secrets.
| Field / concept | Meaning |
|---|---|
| URL | Your HTTPS endpoint that accepts POST JSON |
| Secret | Shared secret for signature verification |
| Events | Which platform events are delivered |
Full setup: Webhooks.
Webhook logs
Path: /dashboard/webhooks/logs
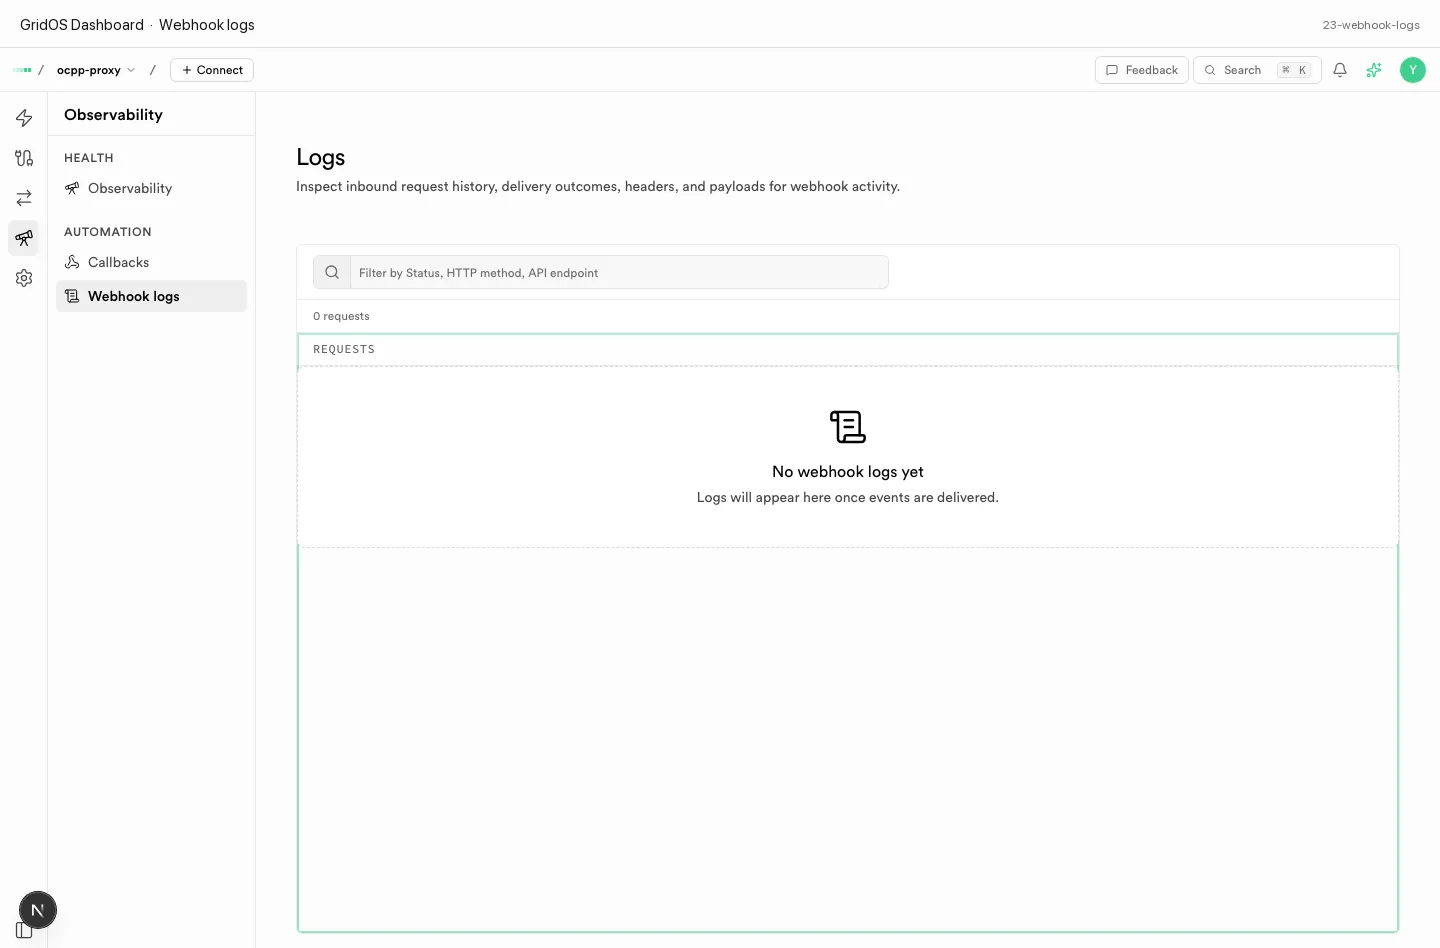
Webhook logs — delivery attempts, HTTP status codes, and retries.
How to use it
- Confirm fleet health on the observability hub after connect.
- Register a callback URL and secret for billing / CRM automation.
- Trigger a test event (for example a session stop).
- Open Webhook logs if the consumer is silent or returns non-
2xx.
Never paste live OCPP passwords, OCPI tokens, or client certificates into tickets, chat, or public issues. Rotate anything that may have been exposed and use Dashboard or your secret store for operational credentials.