Operations home
Dashboard home dashboard: Online, Offline, Stale, and Never connected counts plus connection exceptions.
Path: /dashboard
Operations home is the first screen after sign-in. It shows connection health from the loaded fleet list—not inventing zeros for data you have not loaded.
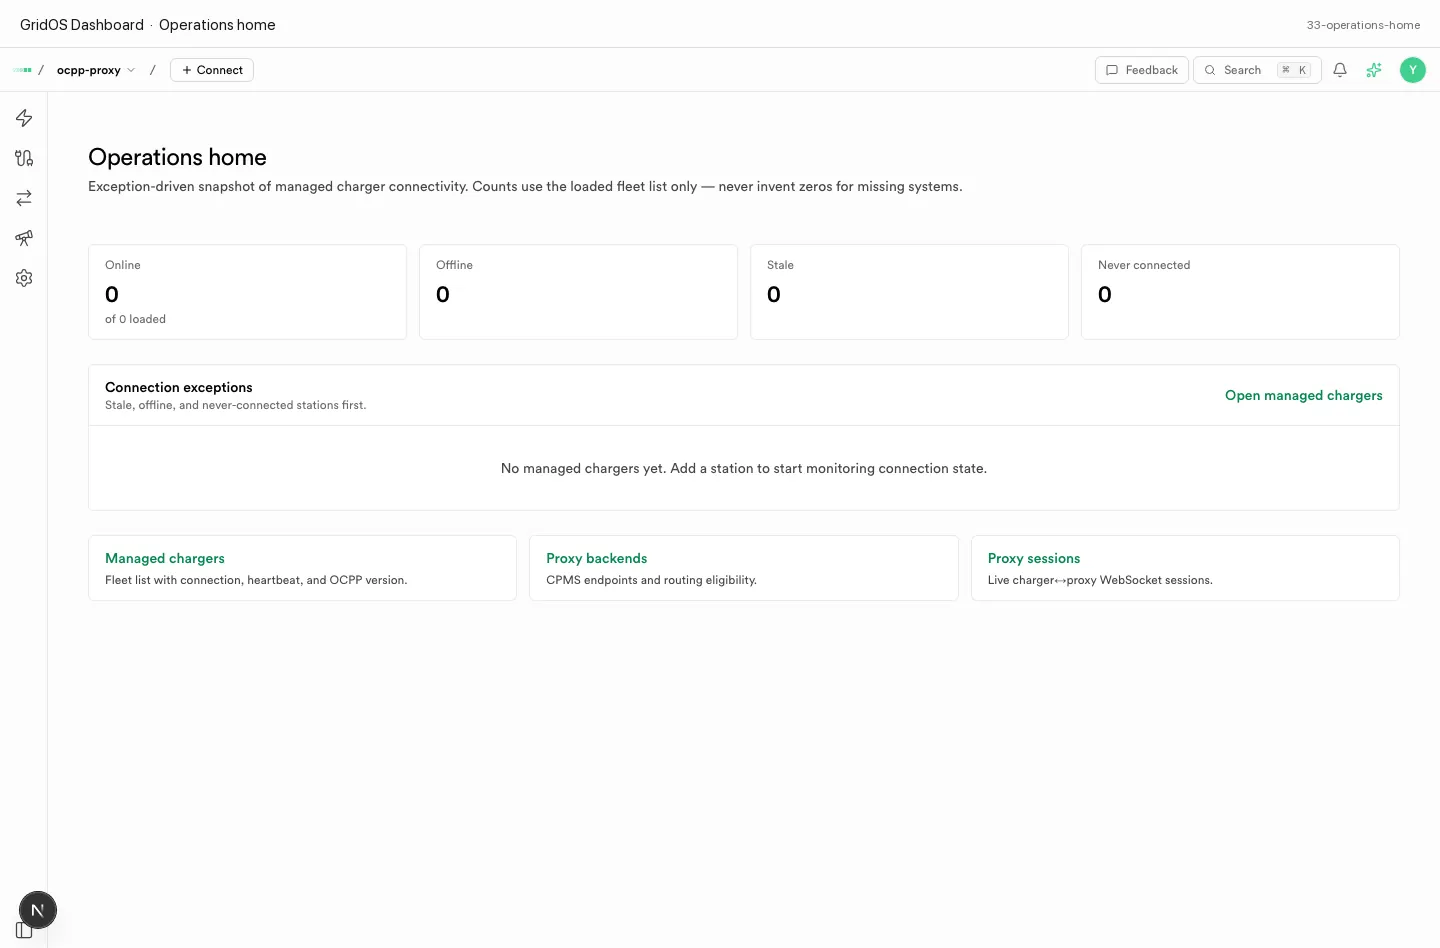
Operations home — Online / Offline / Stale / Never connected and exceptions first.
What you see
| Element | Meaning |
|---|---|
| Online | Stations with a recent authenticated connection / heartbeat |
| Offline | Known stations that are not currently connected |
| Stale | Flagged online but heartbeat is older than the stale threshold |
| Never connected | Registered in the Dashboard but no successful connection yet |
| Exception list | Stations that need attention, ordered for ops triage |
| Shortcuts | Jump into Managed chargers, Proxy backends, or Proxy sessions |
How to use it
- Open the Dashboard and land on
/dashboard. - Scan the four connection counts for a quick fleet pulse.
- Work the exception list top-down (offline and never-connected first).
- Open a row or shortcut into Managed chargers or Proxy for detail.
Related
- Create a charger — register stations that appear as Never connected
- Managed chargers
- Logs